


The company was facing bottlenecks from production surplus, such as no floor space, excessive inventory counts, manual production scheduling, incremental man-handling time. After outlining the value stream map of the process, press and tech utilization, and consistency of customer demand, we implemented a Make to Order (Pull System) – JIT manufacturing as a solution to handle production. Therefore, inventory was replenished as required, with a calculated safety stock of 50% to account for variation.
• Tech Utilization % increased from 20% to 75%.
• Press Utilization increased from 70% to 85%.
• Open space for inventory.
• Accurate inventory counts.
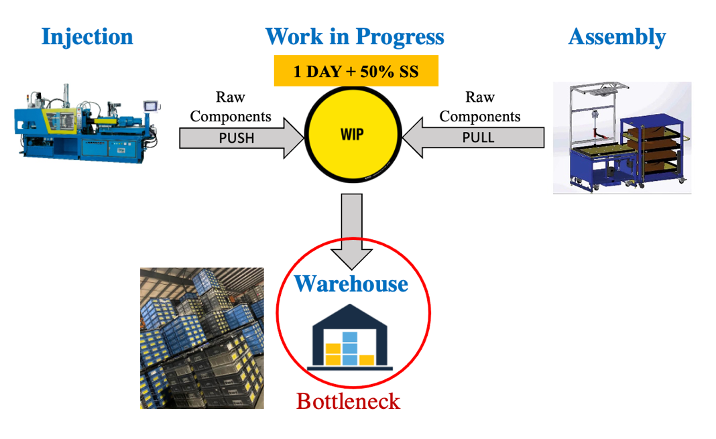
Fig 1. VSM of facility
Fig 1. VSM of facility
Automotive Component Tier-1 Supplier company, part of the Glass and Glass Product Manufacturing Industry. The company was facing bottlenecks from production surplus. These included not having enough floor space for the storage of inventory of current and future program launches. Excessive inventory counts, monthly and daily, to calculate remaining production counts for the week, manual production scheduling based on the inventory counts, incremental man-handling time moving excessive inventory from the warehouse to WIP, in front of the assembly lines. The warehouse would be stacked with excessive inventory, 4-5 days’ worth of inventory, causing inaccurate FIFO replenishment.
There are various possible reasons behind overstocking components, like limited time (because a push system is less risky and more laidback), our daily manual scheduling methods due to constant fallbacks on people or molds (issues), or no warehouse organization (no assigned space).
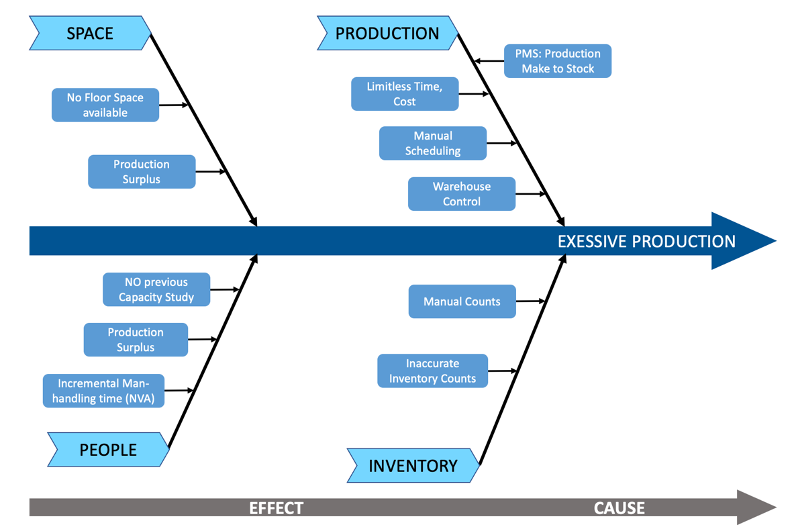
Fig 2. Fishbone diagram
The Six Sigma Tool we utilized is a cause & effect diagram (shows side effects of a problem), which allowed us to see what bottlenecks we face from excessive production. The effects from Excessive production include no floor space. The possible reason behind no floor space is uneven production between LH, RH or production surplus. Product beyond our Safety Stock buffer is considered non-value added, because it does not contribute to direct demand, but it may be needed.
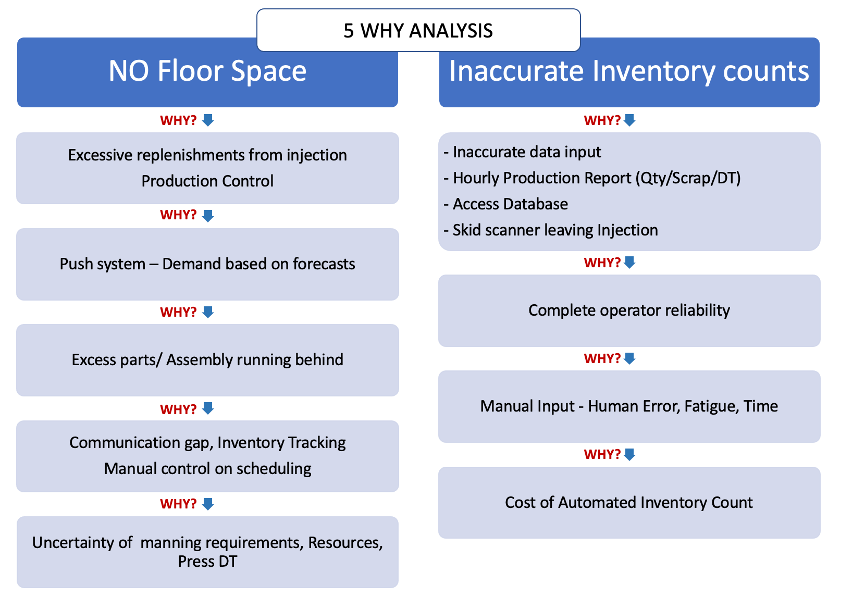
Fig 3. 5 Why’s Analysis
The 5 why’s being a well-known six sigma tool, allowed us to break into the causes of our bottleneck.
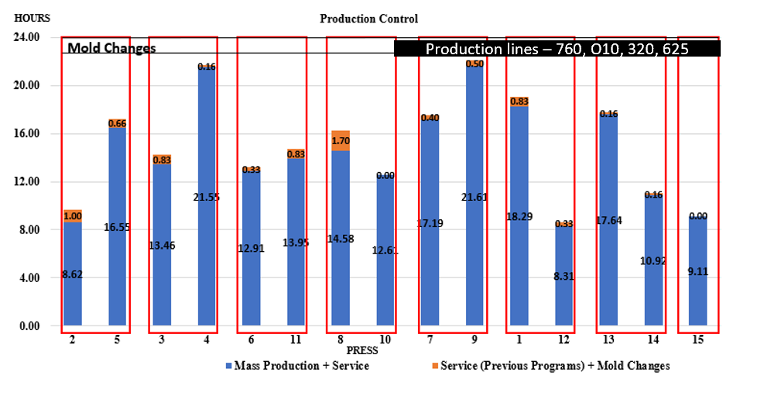
Fig 4. Availability on Press Time for Production modification
Our team decided to look into our press capacity. This chart shows current press utilization based on customer daily demand (pre-pandemic). The orange bars indicate service parts, and the blue are mass production. The y axis is the hours and x axis are the press numbers. It shows we have press time for more components, but mainly that we can afford to run every mold constantly to produce demand, not overproduce.
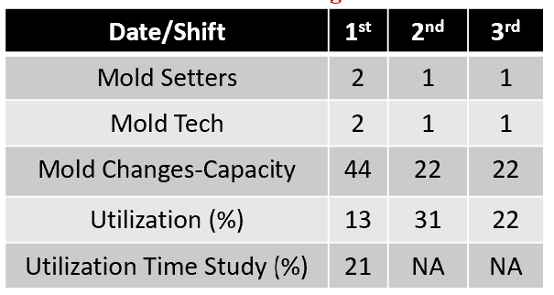
Fig 5. Tech utilization rate per shift
We also conducted a tech utilization study, showing daily mold changes. As for tech capacity, we got these many mold setters/tech. The study indicated a low utilization rate.
After having analyzed our diagram, our group’s goal became to optimize every one of these bottlenecks, which led us to focus on the big picture, which would be improving how run our production system, focusing on streamlining processes.
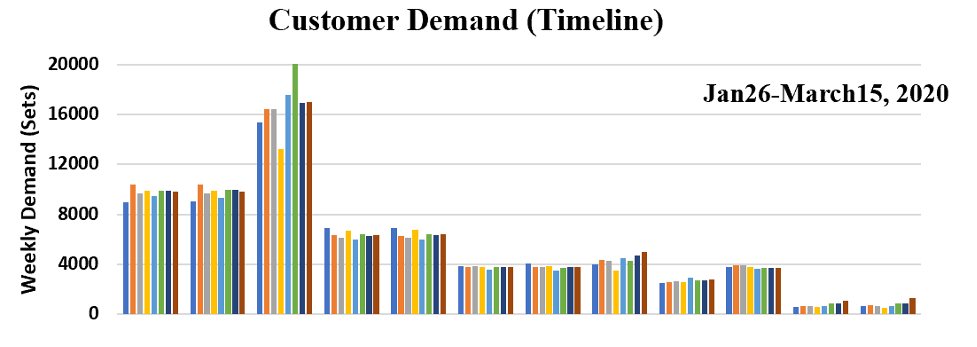
Fig 6. Tech utilization rate per shift
We also looked into the data of our demand for the past years and this year’s Jan-March (pre pandemic), which indicate a steady customer demand for all lines over the periods of various weeks. So consistent demand, as you all see on the chart.
The goal was to decrease man-handling of inventory by optimizing the production system into lean manufacturing. With the pull production system, inventory was produced as required, based on the daily demand with 50% safety stock. 1.5 days of daily demand inventory was placed in front of the assembly lines. Layouts were created using AutoCAD, to optimize the transfer of inventory from WIP to the assembly lines for part production.
Results: The modification on the production system resulted in the following:
1. Decreased time spent on inventory counts by 30%
2. Lean Manufacturing practices in production
3. Decreased non-value-added processes in the facility. Decreased movement of inventory by Production Control operators.
Tell us about it